The US Federal Reserve starts raising interest rates
Dr Shane Oliver - Head of Investment Strategy and Chief Economist, AMP Capital

Key points
- The Fed has finally joined other central banks in raising interest rates, taking the Fed Funds rate from a range of 0-0.25% to 0.25-0.5%. This was well flagged and reflects the tight US labour market and high inflation.
- The Fed flagged another six rate hikes this year and the start of quantitative tightening soon.
- First rate hikes in a tightening cycle don’t normally signal the end of a bull market in shares but they are consistent with a more constrained & rougher ride. High inflation & the war in Ukraine also add to the risks.
- Reflecting similar but less intense inflation pressures, the RBA is expected to start raising rates in June.
Introduction
After much anticipation, the US Federal Reserve has raised its Federal Funds target interest rate from a range of 0-0.25%, where it’s been for the last two years since the pandemic started, to the range of 0.25-0.5%.
Global interest rates
Source: Bloomberg, AMP
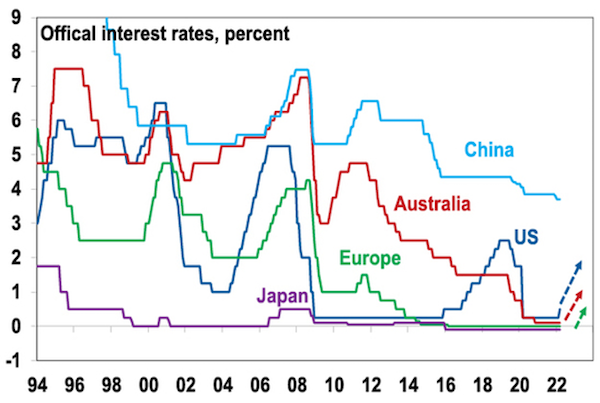
Central banks in various countries including Korea, Norway, NZ, the UK and Canada started raising rates in the last six months as economies recovered, labour markets tightened, and inflation surged in response to supply constraints. The Fed has been flagging the start of rate hikes for this year for six months and started warning of a move in March early this year after inflation kept surprising on the upside. So the move was fully factored into financial markets with US shares actually rallying on positive Fed comments on US economic growth.
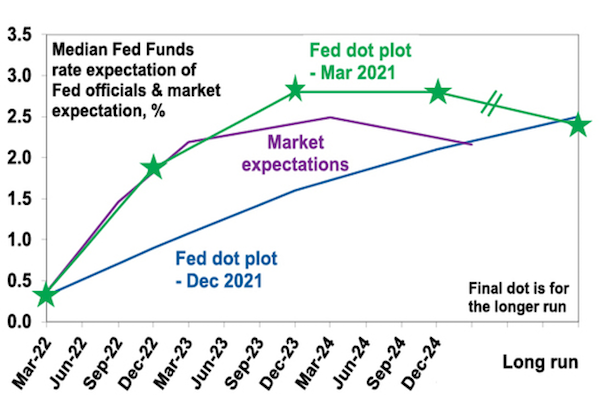
The so called median “dot plot” of Fed officials interest rate expectations has now moved up to seven 0.25% hikes this year from three in December and while the Fed sees uncertainty flowing from the war in Ukraine its now more focused on controlling inflation, seeing the US economy as strong.
Fed "dot plot" versus market expectations
Source: Fed, Bloomberg, AMP
The Fed also signalled that it will likely start Quantitative Tightening (ie, running down its bond holdings – to be achieved by not replacing bonds as they mature) as soon as May.
Why the hike?
The reasons for the hike are simple and are the same as seen in other countries. Economic activity has recovered, the labour market is very tight with unemployment at 3.8% consistent with the Fed’s aim of maximum employment, inflation is at a 40-year high and core inflation is at 6.4%yoy and it’s still rising.
The investment cycle
From a broad cyclical perspective, the Fed joining other central banks in starting to raise interest rates should not be a major concern for investors. But its yet more confirmation that we have moved into a more constrained and volatile phase of the cycle for shares. A typical cyclical bull market has three phases:
- Phase 1 normally starts when economic conditions are still weak and confidence is poor, but smart investors start to see value in shares and anticipate economic and profit recovery helped by easy monetary conditions. In the current bull market this started way back in March/April 2020.
- Phase 2 is driven by rising profits as growth turns up and scepticism turns into optimism. While monetary policy tightens, it is from very easy conditions & remains easy, so bond yields rise, but not enough to derail the bull market.
- Phase 3 sees investors move from optimism to euphoria, which pushes shares into clearly overvalued territory. Meanwhile, strong economic conditions drive significant inflation problems and force central banks to move into tight monetary policy. The combination of clear overvaluation, investors being fully invested and tight monetary policy sets the scene for a new bear market.
What does it mean for investment markets?
Of course, we don’t always make it to investor euphoria, but (abstracting from the uncertainty flowing from the war in Ukraine), we are likely in Phase 2 of the investment cycle. Monetary support is diminishing & we are now more dependent on earnings growth. This shifting of the gears from the Phase 1 valuation driven gains typically sees some slowing in share market gains and more volatility. Against this background:
- The Fed and other central banks are reflecting the reality of economic recovery.
- US monetary policy and that in most other major central banks remains very easy.
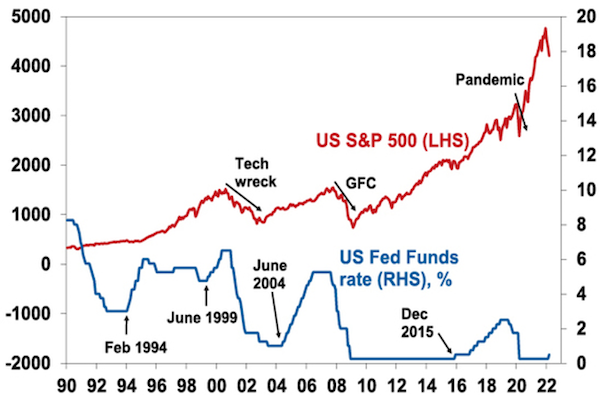
- The experience of the last 30 years suggests that while first rate hikes in a tightening cycle can cause a dip and volatility in shares, the bull market usually resumes until rates become onerously tight, which weighs on economic activity and profits. This can be seen in the next chart. US shares had wobbles when interest rates first started to move up in February 1994 (US shares had a 9% correction), in June 2004 (US shares had an 8% correction) and in December 2015 (US shares had a 13% correction) but thereafter they resumed their rising trend and a bear market did not set in till 2000, 2007 and 2020 after multiple hikes. Of course, the 2020 bear market was ostensibly due to the pandemic. Recession did not come for seven years after the February 1994 first hike, for three and a half years after the June 2004 first hike and for four years after the December 2015 first hike. This is because the first rate hike only takes monetary policy to less easy, and it’s only when monetary policy becomes tight that the economy gets hit.
US shares and interest rates
Source: Bloomberg, AMP
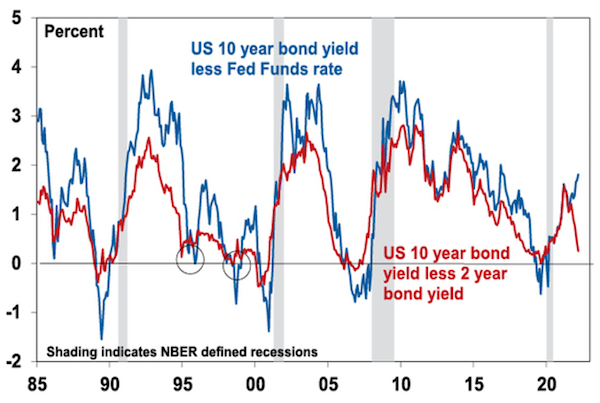
- One guide to whether monetary policy is tight or not is the shape of the yield curve (long-term bond yields less short-term rates) – with a period of long-term bond rates falling below short-term rates often preceding recession in the US. At present different versions of the yield curve (10-year yields less the Fed Funds rate and 10-year yields less the 2-year bond rate) are diverging with a sharp flattening in the latter, but the former has been seen as more reliable and it’s still very steep and a long way from presaging recession.
US yield curve inversions and recessions
Source: Bloomberg, AMP
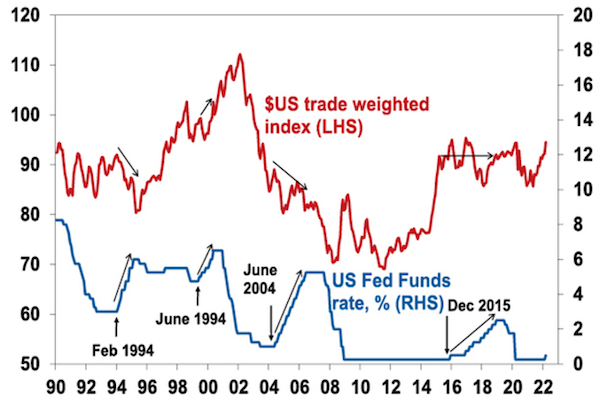
- Despite widespread views to the contrary the relationship between US interest and the US dollar looked at on a trade weighted basis is rather messy. The $US actually fell through the Fed rate hike cycles of 1994-95 and 2004-06 as rate hikes were seen as a sign of economic recovery which reduced haven demand for the $US. And the $US trended sideways through the 2015-18 interest rate hiking cycle. It rose after the resumption of the tightening cycle in 1999 but this reflected the tech boom when the US was all the rage.
The $US and US interest rates
Source: Bloomberg, AMP
In summary, while the Fed’s move to raise rates is consistent with volatile and constrained share market returns ahead, it’s not necessarily consistent with an end to the bull market (or at least the start of a deep bear market) as monetary policy is far from tight and unlikely to be enough to drive a US recession. This is more of a risk for 2024 than for 2023 or 2022.
Risks
While past experience suggests little reason to be too concerned by the first US rate hike, there are two main risks:
- inflation pressures are far more significant than at any time since the early 1980s and this may necessitate an even faster tightening in monetary policy than in the past.
- the war in Ukraine is a major source of uncertainty both in terms of adding to and extending the supply side constraints that are boosting inflation and posing a threat of weaker global growth – notably in Europe.
Provided the conflict in Ukraine does not expand to include Russia directly at war with NATO forces, Russian gas and energy to Europe is not cut off and recovery in production from the pandemic can continue (albeit with periodic setbacks as in China at present) then some pressure may come off inflation (and hence central banks including the Fed) later this year.
Impact on Australian interest rates & the $A
The RBA will soon follow the Fed in starting to raise interest rates. We expect the first hike to come in June taking the cash rate to 0.25%, with three hikes in total this year taking it to 0.75% by year end. This is not because the Fed is raising rates. As the first chart shows the link between US and Australian rates has been tenuous in recent times with the RBA hiking in 2009-10 when the Fed did nothing and the RBA cutting or on hold when the Fed raised rates over 2015 to 2018. They only move together if there is cyclical alignment and this year there is, with both the US and Australia recovering from the pandemic and seeing rising inflation. However, Australian interest rates are likely to rise less than US interest rates reflecting lower inflation in Australia and the start of a downturn in Australian property prices which will dampen the pressure to raise rates much. This means the gap between Australian and US interest rates will likely go negative.
While a decline in the short-term interest rate gap between Australia and the US normally puts downwards pressure on the value of the $A this is likely to be more than offset by strong commodity prices which is being accentuated by the war in Ukraine. As a result, unless there is a global recession, we continue to see the $A rising over the next year.
Important note: While every care has been taken in the preparation of this document, AMP Capital Investors Limited (ABN 59 001 777 591, AFSL 232497) and AMP Capital Funds Management Limited (ABN 15 159 557 721, AFSL 426455) make no representations or warranties as to the accuracy or completeness of any statement in it including, without limitation, any forecasts. Past performance is not a reliable indicator of future performance. This document has been prepared for the purpose of providing general information, without taking account of any particular investor’s objectives, financial situation or needs. An investor should, before making any investment decisions, consider the appropriateness of the information in this document, and seek professional advice, having regard to the investor’s objectives, financial situation and needs. This document is solely for the use of the party to whom it is provided.