National property prices fall for the first time since the pandemic
– expect a 10-15% top to bottom fall
Dr Shane Oliver - Head of Investment Strategy and Chief Economist, AMP Capital

Key points
- Australian home prices fell 0.1% in May, their first decline since the pandemic.
- The main drivers behind the downturn are: poor affordability with prices up nearly 29% over 21 months; rising mortgage rates; a rotation in spending away from housing; and a decline in home buyer confidence.
- We continue to expect a 10-15% fall in home prices.
- While the RBA is set to continue raising interest rates, the negative wealth effect from falling home prices will limit how much it ends up raising rates by as it does not want to crash house prices and the economy.
First fall in home prices since the pandemic
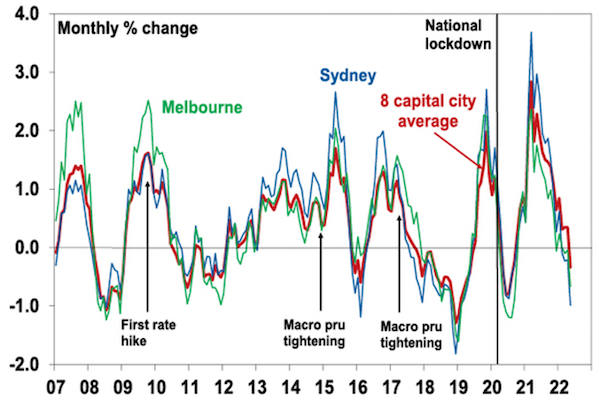
After a massive 28.6% gain from their pandemic low – which was the biggest gain over 21 months since 2003 – national average home prices fell for the first time in May since September 2020 based on CoreLogic data. While national average dwelling prices fell 0.1%, they were led by falls of 1% in Sydney and 0.7% in Melbourne. Sydney prices have now fallen for four months in a row and Melbourne prices for three months. Momentum in monthly home price growth has been steadily slowing since it peaked at 2.8% in March last year.
| |
May % change
|
12 mths to May, % chg
|
|
Sydney
|
-1.0
|
10.3
|
|
Melbourne
|
-0.7
|
5.8
|
|
Brisbane
|
0.8
|
27.8
|
|
Adelaide
|
1.8
|
26.1
|
|
Perth
|
0.6
|
5.6
|
|
Hobart
|
0.3
|
17.3
|
|
Darwin
|
0.5
|
6.4
|
|
Canberra
|
-0.1
|
18.7
|
|
Capital city average
|
-0.3
|
11.7
|
|
Cap city houses avg
|
-0.4
|
13.4
|
|
Cap city units avg
|
-0.2
|
6.6
|
|
Regional average
|
0.5
|
22.1
|
|
National average
|
-0.1
|
14.1
|
Source: CoreLogic, AMP
The property cycle turns
Residential property prices boomed last year on the back of record low mortgage rates, government incentives, recovery from the lockdowns of 2020, a lack of supply, coronavirus driving a switch in consumer spending from services (like holidays) to “goods” including housing and FOMO (or a fear of missing out). However, it’s now turned down decisively.
Average capital city home prices

Source: Source: CoreLogic, AMP
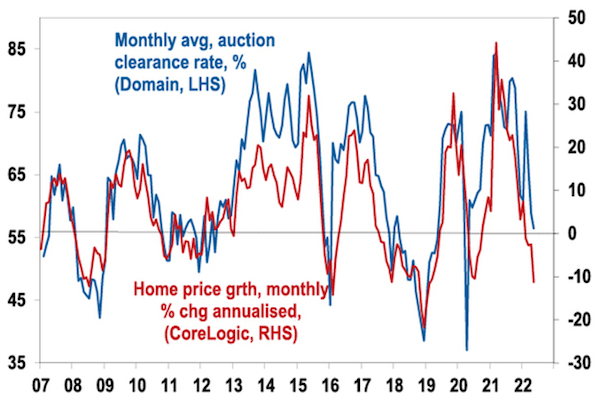
Declining auction clearance rates also point to a slowdown – although so far clearances are lagging the falls in prices.
Sydney auction clearance rate and home price growth

Source: Source: Domain, CoreLogic, AMP
The seven drivers of the property downturn
The drivers of the downturn are a combination of:
- deteriorating affordability with the 29% surge in prices since the pandemic comparing to wages growth around 2.3% pa;
- a more than doubling in fixed mortgage rates from around 2% to around 5%;
- the start of RBA monetary tightening which is pushing up variable mortgage rates;
- a rise in new listings in Sydney and Melbourne;
- a rotation in spending from goods back to services;
- high inflation making it harder to save for deposits; and
- a decline in consumer and home buyer confidence.
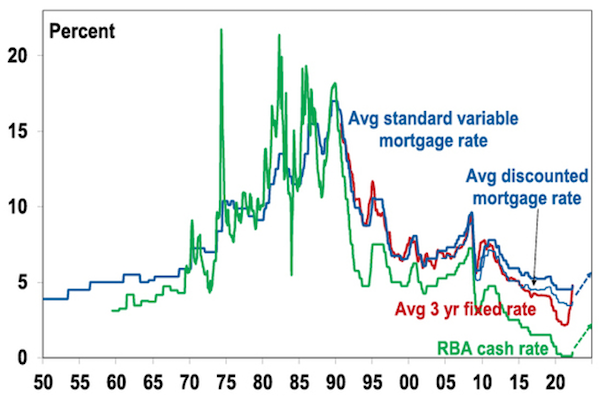
The deterioration in affordability has priced many out of the market. But the main driver of the downturn is the upswing in interest rates. This started last year with rising fixed mortgage rates (on the back of rising long term bond yields). Being able to borrow at a fixed rate of 2% or less was a key driver of the boom in prices with fixed rate lending accounting for 40-50% of new lending about a year ago, compared to a norm of around 15%. But with fixed mortgage rates roughly doubling over the last 12 months combined with an increase in the interest rate serviceability buffer from 2.5% to 3% this has substantially reduced the amount new home buyers can borrow and hence their capacity to pay. As a result, the share of fixed rate home lending has fallen back to around 15% but variable rates are now rising too as the RBA continues to raise the cash rate. The net effect is a sharp dampening in home buyer demand.
Australian interest rates on the rise

Source: RBA, AMP
The slowing trend since March last year has been led by Sydney and Melbourne, reflecting their more expensive housing and greater vulnerability to higher interest rates at a time when interstate migration was still helping to boost demand in cities like Brisbane and regional property remained in hot demand, kicked off by the pandemic. However, other cities and regional areas are now also seeing a loss of momentum.
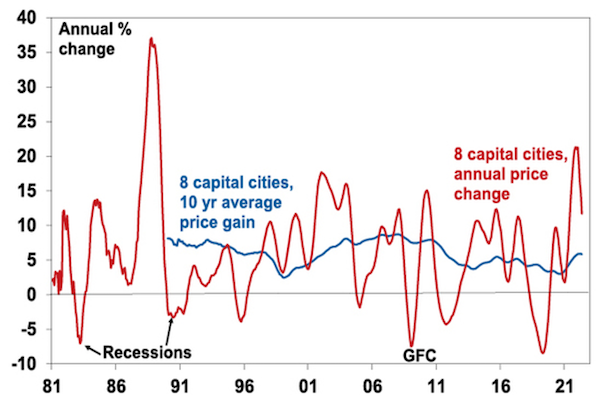
The slowdown in monthly price growth is seeing annual price growth roll over too. Simple mean reversion after a period of well above average growth warns of a further slowdown ahead.
Annual home price growth is now slowing rapidly too

Source: CoreLogic, AMP
Expect average property prices to fall 10 to 15%
National average property prices have likely now peaked and we continue to expect a peak to trough fall of around 10% to 15% reflecting the combination of: poor affordability; rising fixed mortgage rates; monetary tightening from the RBA pushing up variable rates by around 2% out to mid next year; higher listings in Sydney and Melbourne; a rotation in consumer spending back towards services; high inflation which is making it harder to save for a deposit; and a collapse in home buyer confidence.
Likely reflecting increased sensitivity to higher interest rates property prices have also started falling a bit faster than we initially anticipated. So, after 22% growth in national average home prices last year, home prices this year are now expected to fall 2% (revised down from flat) and we expect around a 10% decline in average prices in 2023 (unchanged). Top to bottom, the fall in prices is still likely to be around 10-15%. Seen in the context of the huge 29% plus surge in prices since their 2020 low this will just take average prices back to the levels of around March last year, so a big rise in negative equity is unlikely. However, those who purchased in the last 18 month on low deposits are at risk of negative equity.
Sydney, Melbourne and Canberra are likely to be hardest hit, Brisbane and Adelaide may hold up for a few months longer and Perth and Darwin may hold up better as Perth is only just above its 2014 high and Darwin is still below. Regional prices may also continue to benefit. Units may not fall as much as they did not go up as much. However, most areas of the property market will be impacted as rising rates impact buyer demand
What are the risks?
The main upside risk to our forecast for a 10-15% fall in prices would be a rapid surge in immigration, although this is likely to show up initially in higher rents and then higher prices with a lag. The new round of 60,000 low deposit home loan guarantees, and 10,000 places in the Government’s “Help to Buy” scheme, will provide some support to property prices but are unlikely to be enough to prevent the unfolding downswing.
The more significant risks are probably to the downside and relate to the risks around the first interest rate hikes in over 11 years coming when household debt to income and house price to income ratios are way higher than they were when the last rate hiking cycle started in 2009. RBA analysis suggests most households are well ahead on their mortgage payments and have built up significant buffers and if banks have been appropriately applying APRA interest rate serviceability tests, then borrowers in recent years should be able to withstand a 2.5% (or 3%, since October) rise in their mortgage rate. So while there will be an increase in mortgage stress we do not expect to see an avalanche of forced selling crashing prices, but rather see weaker demand as being the main driver of lower prices. Given the unknowns around how new borrowers will cope with higher rates this is probably the biggest risk though.
Falling home prices will limit how much the RBA hikes
The offset to this risk though is that the RBA does not operate in isolation and will be closely watching for the impact of rising interest rates. Falling home prices will do part of the RBA’s job for it – via negative wealth effects on consumer spending (ie home prices fall, we feel poorer, we slow down spending and this takes pressure off inflation). So if house prices start to fall rapidly with significant evidence of rising mortgage stress then the RBA will be able to ease up on the interest rate brake. The fact that prices are already starting to fall tells us that rate hikes are already getting traction suggesting that it may not have to raise rates as much as would otherwise be the case, with the peak in the cash rate being, say, 2% rather than the 3% plus that the money market is predicting.
Concluding comment
At present the property downswing starting to unfold looks like just another cyclical downswing but note that the 25-year bull market in capital city property prices may fade in the years ahead as: the 30 year declining trend in inflation and hence mortgage rates which has enabled new buyers to progressively borrow more and more, and hence pay more and more for property is now likely over; and the work from home phenomenon and associated shift to regions may continue to take some pressure off capital city prices.
Important note: While every care has been taken in the preparation of this document, AMP Capital Investors Limited (ABN 59 001 777 591, AFSL 232497) and AMP Capital Funds Management Limited (ABN 15 159 557 721, AFSL 426455) make no representations or warranties as to the accuracy or completeness of any statement in it including, without limitation, any forecasts. Past performance is not a reliable indicator of future performance. This document has been prepared for the purpose of providing general information, without taking account of any particular investor’s objectives, financial situation or needs. An investor should, before making any investment decisions, consider the appropriateness of the information in this document, and seek professional advice, having regard to the investor’s objectives, financial situation and needs. This document is solely for the use of the party to whom it is provided.