The property cycle and the economy
Dr Shane Oliver
Head of Investment Strategy and Chief Economist
AMP Capital
October 2018

How far and for how long and what’s the impact on the economy?
Key points
- Property prices in Sydney and Melbourne are likely to see top to bottom falls of around 20% as credit conditions tighten, supply rises and a negative feedback loop from falling prices risks developing.
- Other cities will perform better having not seen the boom of the last few years.
- Property investors should remain wary of Sydney and Melbourne for now & focus on higher yielding markets.
Introduction
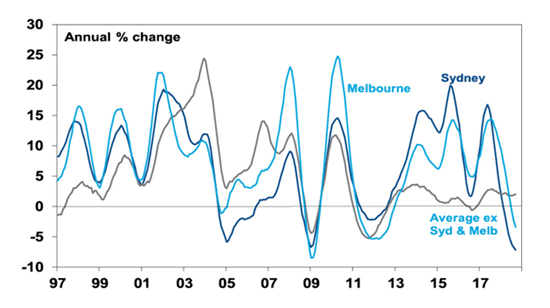
Australian capital city home prices have fallen for 12 months in a row and are down 4% from their peak. Most of the weakness relates to the previous boom time cities of Sydney and Melbourne but prices are continuing to fall in Perth and Darwin.
Source: CoreLogic, AMP Capital
This begs the questions: how far will prices drop? and what will it mean for the broader economy?
High prices and high debt – how did it come to this?
The big picture view on Australian property is:
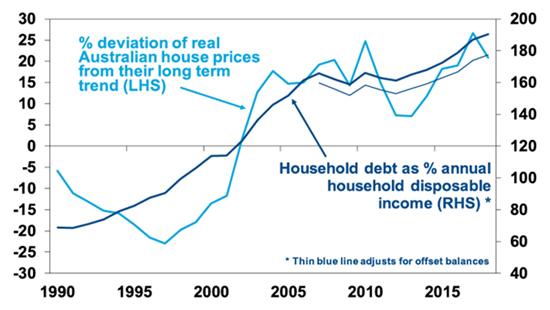
- Real house prices started to surge in the mid-1990s. This has led to them being expensive relative to income, rents, their long-term trend and by global standards. On our valuation measures prices are around 30% overvalued. The boom since the mid-1990s has rolled through different cities at different times, eg, starting in Sydney & Melbourne, then Perth, then Sydney & Melbourne again more recently.
- As a result, affordability is poor and while interest rates may be low it’s become hard to save for a sufficient deposit.
- The surge in home prices has gone hand in hand with a surge in household debt. See the next chart. This has taken the household debt to income ratio from the low end of OECD countries to the top end. The shift to overvaluation and high debt mostly occurred over the 1995-2005 period.
Home prices and household debt have gone up together
Source: OECD, RBA, AMP Capital
It’s popular to blame negative gearing, the capital gains tax discount and foreign buying for high home prices and debt. However, the basic drivers are a combination of the shift from high to low interest rates over the last 20-30 years boosting borrowing power, along with a surge in population growth from mid-last decade and the inadequacy of a supply response (thanks to tight development controls and lagging infrastructure) to suppress the resultant rise in the ratio of prices to incomes. Since 2006, annual population growth has averaged about 150,000 above what it was over the decade to the mid-2000s, which required roughly an extra 50,000 new homes per year, but dwelling completions have only recently caught up.
The tide has turned – expect more price falls
However, starting about a year ago it seems the tide has turned against property prices reflecting a range of factors:
- Poor affordability - which has reduced the pool of buyers.
- A tightening in bank lending standards under pressure from regulators - particularly around tougher income and expense verification and total debt to income limits for borrowers. The latter will particularly impact cities like Sydney and Melbourne which have high price to income ratios necessitating high debt to income ratios. It will also impact property investors with multiple properties (with around 1.5 million properties held by investors with multiple properties) with banks cracking down on lending to such investors. This is all making it harder to get housing loans.
- A significant pool of interest only borrowers are scheduled to switch to principal and interest over the next few years resulting in a sharp rise in total debt servicing costs.
- Banks withdrawing from lending to Self-Managed Super Funds – reducing the pool of property investors.
- A cutback in foreign demand, partly due to Australian authorities making it more difficult. Chinese investment into Australian real estate has fallen by roughly 70% since 2015.
- Rising unit supply – as the ongoing surge in unit construction completes and hits the market with Sydney and Melbourne most at risk. This risk is highlighted by Australia’s residential crane count of 528 cranes being way above the total crane count (ie residential and non-residential) in the US of 300 and Canada of 123!
- Out of cycle bank mortgage rate increases may also be playing a role – although a minor one as the moves have been small, mortgage rates remain near record lows and some banks have cut rates for new borrowers.
- Falling price growth expectations in response to falling prices risks resulting in a negative feedback loop for prices – as the FOMO (fear of missing out) phenomenon of up until a year ago risks turning into FONGO (fear of not getting out), particularly for investors as they realise they are only getting very low returns from net rental yields of around 1-2%.
- • Expectations that negative gearing and capital gains tax concessions will be made less favourable if there is a change of government are likely also impacting and have the potential to become a major drag on prices.
On their own some of these are not significant, but together they risk creating a perfect storm for the property market.
Home price outlook
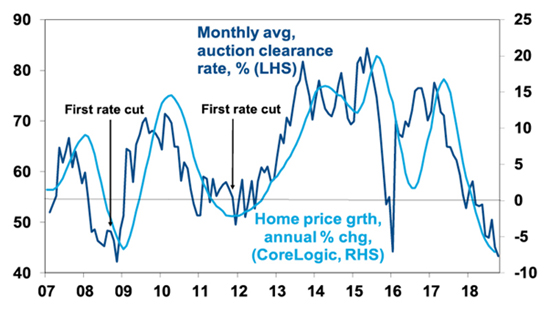
For some time, we have been expecting top to bottom falls in Sydney and Melbourne prices of 15% spread out to 2020, implying price declines around 5% per annum. However, the risks are starting to skew to the downside – particularly around tighter credit and falling capital growth expectations made worse by fears of a change in tax arrangements. Auction clearances in recent weeks have been running around levels roughly consistent with 7-8% pa price declines. See next chart.
Source: Domain, AMP Capital
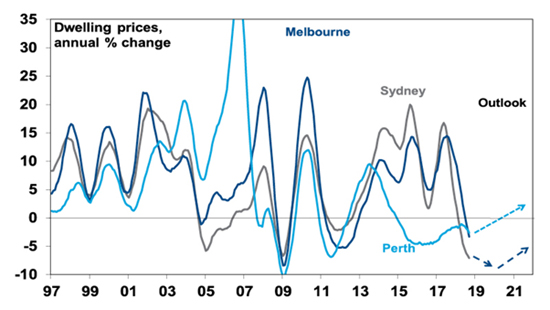
As such we are now allowing for a 20% decline in prices in these cities, again spread out to 2020, which would take average prices back to first half 2015 levels.
Property prices have a lot more downside in Sydney & Melbourne
Source: CoreLogic, AMP Capital
By contrast home prices in Perth and Darwin are either at or close to the bottom having fallen back to levels seen more than a decade ago, and prices are likely to perform a lot better in Adelaide, Brisbane, Canberra and Hobart along with regional centres as they have not seen anything like the boom in Sydney and Melbourne. But they will see some impact from tighter credit. Overall, we now expect national average prices to fall nearly 10% out to 2020 which is a downgrade from our previous expectation for a 5% national average fall.
A crash is a risk but remains unlikely
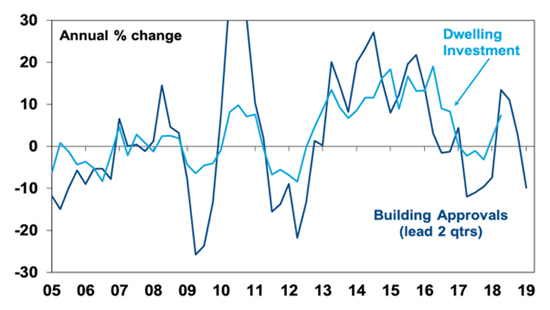
With prices now falling naturally the calls for a property crash are getting a lot of airing. But these have been wheeled out endlessly over the last 15 years or so. Our assessment remains that a crash (say a 20% or more fall in national average prices) is unlikely unless we see much higher interest rates or unemployment (neither of which are expected) or a continuation of recent high construction for several years (which is unlikely as approvals are falling) and a collapse in immigration.
Strong population growth is continuing to drive strong underlying demand for housing. While mortgage stress is a risk, it tends to be overstated: there has been a sharp reduction in interest only loans already; debt servicing payments as a share of income have actually fallen slightly over the last decade; a significant number of households are ahead on their repayments; and banks’ non-performing loans remain low. Finally, while Sydney and Melbourne are at risk other cities have not seen the same boom and so are less vulnerable.
However, the risk of a crash cannot be ignored given the danger that banks may overreact and become too tight and that investors decide to exit in the face of falling returns, low yields and possible changes to negative gearing and capital gains tax.
The property cycle and the economy
The downturn in the housing cycle will affect the broader economy via slowing dwelling construction, negative wealth effects on consumer spending, less demand for household goods and via the banks as credit growth slows and if mortgage defaults rise. This will provide an offset to strong growth in infrastructure spending and solid growth in business investment and will constrain economic growth to around 2.5-3% which in turn will keep wages growth and inflation low. All of which is consistent with our view that the RBA won’t be raising rates until 2020 at the earliest and given the downside risks related to house prices it may have to cut rates. Housing weakness will also continue to constrain bank share returns.
Source: ABS, AMP Capital
Implications for investors
Over the very long-term, residential property adjusted for costs has similar returns to Australian shares. So, there is a role for it in investors’ portfolios. However, now remains a time for caution regarding housing as an investment destination – particularly in Sydney and Melbourne where it remains expensive, prices are likely to fall further & it offers very low rental yields. Best to look at other cities and regional areas that offer much better value.
Dr Shane Oliver
Head of Investment Strategy and Chief Economist
AMP Capital
Important note: While every care has been taken in the preparation of this document, AMP Capital Investors Limited (ABN 59 001 777 591, AFSL 232497) and AMP Capital Funds Management Limited (ABN 15 159 557 721, AFSL 426455) make no representations or warranties as to the accuracy or completeness of any statement in it including, without limitation, any forecasts. Past performance is not a reliable indicator of future performance. This document has been prepared for the purpose of providing general information, without taking account of any particular investor’s objectives, financial situation or needs. An investor should, before making any investment decisions, consider the appropriateness of the information in this document, and seek professional advice, having regard to the investor’s objectives, financial situation and needs. This document is solely for the use of the party to whom it is provided.